Report

src

Global Anti-Aging Market Size, Share & COVID-19 Impact Analysis, By Product (Serums, Creams, Gels and Others), By Target Group (Male and Female), By Ingredient (Retinoid, Hyaluronic Acid, Alpha Hydroxy Acid and Others), By Distribution Channel (Pharmacies, Stores and Online Stores), By Treatment (Body Care Treatment and Facial Care Treatment), and Regional Forecasts, 2023-2030

Customization
  • We provide customized solutions to cater to your specific requirement services any region, product, or any specific market segment.
The global anti-aging market size was valued at USD 62.3 billion in 2022. The market is projected to grow from USD 62.3 billion in 2022 to USD 90.9 billion by 2030, exhibiting a CAGR of 6.50% during the forecast period.
 
A growing number of cosmetic procedures are being conducted globally, the older population is increasing, technology is advancing, and people are becoming more aware of cutting-edge cosmetic procedures, all promoting the rise. The anti-aging market is driven by innovative anti-aging treatments and products including plastic surgery, breast implants, botulinum toxin injection therapies, etc., that offer long-term outcomes due to technological developments and significant research and development efforts. The introduction of safer, more effective anti-aging treatments that provide consumers with immediate effects has also been promoted by tight rules and regulations, expanding the market's growth prospects.
 
RECESSION IMPACT

The anti-aging market is predicted to suffer from the recession. Businesses of all sizes experience decreased sales and earnings during a recession. They may also make it more difficult to obtain finance, make it harder to get paid and promote corporate bankruptcy. While every firm is affected differently by recessions, some of the challenges can be predicted based on the kind and size of the organization. While a small consulting firm can experience cash flow issues when clients delay paying invoices, a Fortune 500 company might be able to reduce costs by cutting roles and negotiating better terms with suppliers. Recessions can reduce credit options, make it more difficult to collect payments, and result in corporate bankruptcy.
 
DRIVING FACTORS

Rising Awareness Among Individuals Related to Skincare Routine to Promote Market Growth

People around the world, particularly in emerging and developed nations, are becoming more aware of the effects of ageing skin and the myriad issues that come with it, including smoothness, dullness, reduced plumpness, and fine lines and wrinkles. The availability of cost-competitive products and anti-aging remedies, rising standards of living, rising incomes and purchasing power among middle-aged customers are only a few of the key variables anticipated to contribute to market revenue growth significantly. Recently, more people have taken part in reviews and surveys thanks to the increased visibility of these items online and on social media platforms, as well as reviews from customers who are currently using or have previously used anti-aging therapies. Major changes in hair and skin occur in the years before and during menopause, and many of the issues women experience are brought on by cascading estrogen levels. For many businesses, tackling these issues and offering substantial answers has created new opportunities. A few brands that have successfully cornered the industry and are increasing their anti-aging market revenue growth are Womaness, Pause, and Care.
 
RESTRAINING FACTORS

Rising Cost of Anti-Aging Products to Limit Market Growth

Hyaluronic acids are natural chemicals that are used as the basis for anti-aging products. The cost of goods sold has increased, including raw materials and packaging. The primary material of the packaging, plastic, also has a major impact on the final product's price. The cost of substances used in cutting-edge research and technology, including synthetics, UV agents, fatty acids, SPF compounds, and essential oils, has increased. The price of natural components including Quillaja Saponaria, honey, Acacia concinna or Sapindus,jojoba, and algae has soared as a result of growing transportation and processing expenses. Due to the growth in demand and resultant lack of these natural substances, prices have increased.
 
SEGMENTATION

By Product

Anti-Aging Market By Product
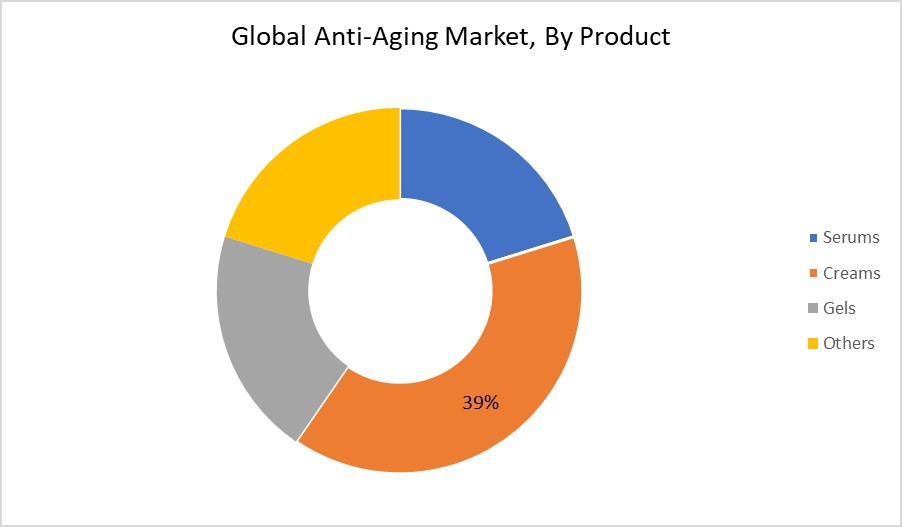
Based on product, the anti-aging market is segmented into serums, creams, gels and others. The creams category dominated the market in 2022. Many cream-based anti-aging products are on the market, such as eye, face, and anti-wrinkle creams. They also help to shield the skin from damaging UV rays. Due to the popularity of creams among consumers, major players in the anti-aging cosmetics market are continually doing R&D to enhance them.
 
By Target Group

Based on target group, the anti-aging market is segmented into male and female. The female category dominated the market in 2022 because they tend to groom their skin more and care greatly about their appearance. Additionally, because women outlive men on average, a larger proportion of older women drives up demand for anti-aging products among women.
 
By Ingredient

Based on ingredient, the anti-aging market is segmented into retinoid, hyaluronic acid, alpha hydroxy acid and others. The hyaluronic acid category dominated the market in 2022 because of the many advantages and functions that hyaluronic acid serves in your body. Hyaluronic acid helps skin flex and stretch while also minimizing lines and wrinkles. It has also been demonstrated to facilitate wound healing and lessen scarring. It is also authorized for injection beneath the skin are fillers made of collagen and hyaluronic acid, two natural proteins in your body. When used to heal acne scars or accentuate lips, these fillers aid in restoring the form and look of the body.
 
By Distribution Channel

Based on distribution channel, the anti-aging market is segmented into pharmacies, stores and online stores. The stores category dominated the market in 2022. Customers prefer supermarkets for beauty goods, including anti-aging ones, for several reasons, including the benefits of a variety of choices, availability of a wide range of standard items, lower operation costs translating into lower product costs, and greater discounts. For sellers as well, it is a very practical method of selling because there is no consumer haggling, allowing pricing to be set. The margin profit in supermarkets is typically maintained low, allowing for more profits. Increased sales of anti-aging products through supermarkets and hypermarkets are the outcome of such positive variables.
 
By Treatment

Based on treatment, the anti-aging market is segmented into body care treatment and facial care treatment. The facial care treatment category dominated the market in 2022. The global market is anticipated to grow faster during the forecast period due to rising consumer awareness of age-related skin issues such fine lines, wrinkles, and dull skin, as well as rising consumer propensity to spend on goods that maintain skin youth. A physiological change is aging as well. The contribution of skin cells to premature aging is thought to be negatively impacted by external variables such air pollution, alcohol intake, and UV exposure. Thus, this is driving the facial care treatment category.
 
REGIONAL INSIGHTS

Anti-Aging Market By Region 
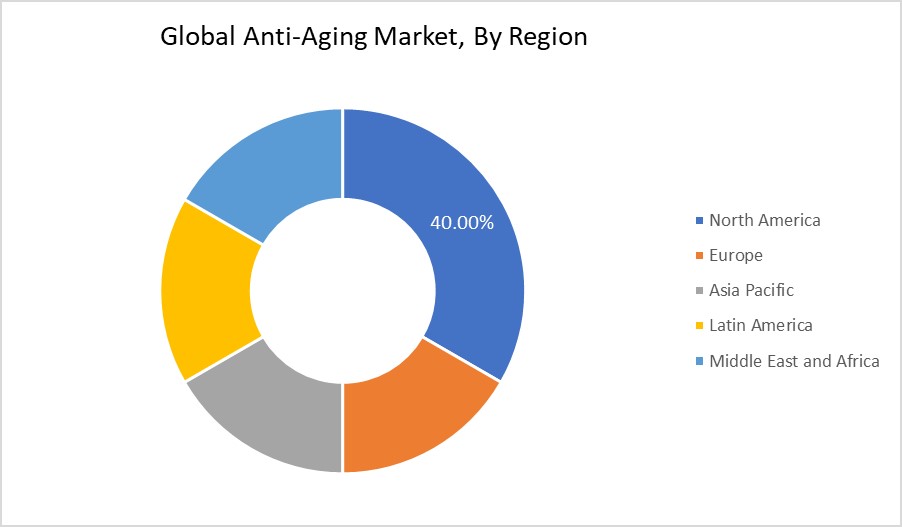
North America is projected to hold the largest share of the anti-aging market over the forecast period. This is mostly due to three factors: a growing preference for non-surgical therapies, expanding consumer knowledge of at-home products, and an increase in the number of cosmetic procedures carried out in the United States and Canada. Other variables that motivate consumers to utilize these items in the region include the rising disposable income, the rising acceptance of skin rejuvenation & resurfacing procedures, the surging popularity of cosmetic products, the growing senior population, and the rising number of skin issues. On the other hand, Europe anti-aging market is anticipated to grow significantly. Due to the presence of well-known players and the growing elderly population in the area, this increase can be largely attributed to these factors. Additionally, Europe is the world's top exporter of cosmetic products, with gems and jewelry, cosmetics, and engineering products making up the majority of the exported stock. In addition, the region is seeing an increase in the number of surgical and non-surgical operations, which is helping the sector develop.
 
LIST OF KEY COMPANIES PROFILED:
  • Allergan
  • L’Oréal
  • Beiersdorf
  • Estee Lauder
  • Procter & Gamble
  • Shiseido
  • Unilever
Recent Development:
  • In July 2020, Lancer Skincare will debut the Pro Polish microdermabrasion tool.
  • In December 2019, Have & Be Co. Ltd, a global skincare company with locations in Seoul and the brands Dr. Jart+ and Do The Right Thing for men's grooming products, was acquired by Estee Lauder Companies Inc.
REPORT SCOPE AND SEGMENTATION
 
Attributes Details
Market Size in 2022 USD 62.3 Billion
Market Forecast in 2030 USD 90.9 Billion
Compound Annual Growth Rate 6.50%
Unit Revenue (USD Million) and Volume (Kilo Tons)
Segmentation By Product, By Target Group, By Ingredient, By Distribution Channel, By Treatment and By Geography
By Product
  • Serums
  • Creams
  • Gels
  • Others
By Target Group
  • Male
  • Female
By Ingredient
  • Retinoid
  • Hyaluronic Acid
  • Alpha Hydroxy Acid
  • Others
By Distribution Channel
  • Pharmacies
  • Stores
  • Online Stores
By Treatment
  • Body Care Treatment
  • Facial Care Treatment
By Region
  • North America: U.S and Canada
  • Europe: Germany, Italy, Russia, U.K, Spain, France, Rest of Europe
  • APAC: China, Australia, Japan, India, South Korea, South East Asia, Rest of Asia Pacific
  • Latin America: Brazil, Argentina, Chile
  • The Middle East And Africa: South Africa, GCC, Rest of MEA
Base Year 2022
Historical Year 2016-2021
Forecast Year 2023-2030
Chapter 1    Preface

    1.1    Report Scope and Description
        1.1.1    Study Purpose
        1.1.2    Target Audience
        1.1.3    USP and Key Offerings
    1.2    Key Benefits for Stakeholders
    1.3    Report Scope

Chapter 2    Report Summary

    2.1    Key Findings
        2.1.1    Top Investment Pockets
    2.2    Market Snapshot: Global Anti-Aging Market
    2.3    Global Anti-Aging Market, 2018 – 2028 (US$ Mn)

Chapter 3    COVID 19 Impact Analysis

    3.1    Impact Assessment of COVID-19 Pandemic, By Region
        3.1.1    North America: Impact of COVID-19 Pandemic
        3.1.2    Europe: Impact of COVID-19 Pandemic
        3.1.3    Asia pacific: Impact of COVID-19 Pandemic
        3.1.4    Latin America: Impact of COVID-19 Pandemic
        3.1.5    Middle-East and Africa: Impact of COVID-19 Pandemic
    3.2    Key Strategies Undertaken by Companies to Tackle COVID-19
    3.3    Quarterly Market Revenue by Region 2021 & 2022
    3.4    Pre COVID-19 Market Revenue, By Region, 2016-2019        (USD Million)
    3.5    Post COVID-19 Market Revenue, By Region, 2020-2028 (USD Million)
    3.6    Short Term Dynamics
    3.7    Long Term Dynamics

Chapter 4    Global Anti-Aging Market, By Product Segment Analysis

    4.1    Anti-Aging Market Overview, By Product Segment
        4.1.1    Global Anti-Aging Market Revenue Share, By Product, 2022 & 2028 (Value, %)
    4.2    Serums
        4.2.1    Anti-Aging Share Forecast, By Region (USD Million)
        4.2.2    Comparative Revenue Analysis, By Country, 2021 & 2028
        4.2.3    Key Market Trends, Growth Factors, & Opportunities
    4.3    Creams
        4.3.1    Anti-Aging Share Forecast, By Region (USD Million)
        4.3.2    Comparative Revenue Analysis, By Country, 2021 & 2028
        4.3.3    Key Market Trends, Growth Factors, & Opportunities
    4.4    Gels
        4.4.1    Anti-Aging Share Forecast, By Region (USD Million)
        4.4.2    Comparative Revenue Analysis, By Country, 2021 & 2028
        4.4.3    Key Market Trends, Growth Factors, & Opportunities
    4.5    Others
        4.5.1    Anti-Aging Share Forecast, By Region (USD Million)
        4.5.2    Comparative Revenue Analysis, By Country, 2021 & 2028
        4.5.3    Key Market Trends, Growth Factors, & Opportunities
        
Chapter 5    Global Anti-Aging Market, By Target Group Segment Analysis

    5.1    Anti-Aging Market Overview, By Target Group Segment
        5.1.1    Global Anti-Aging Market Revenue Share, By Target Group, 2022 & 2028 (Value, %)
    5.2    Male
        5.2.1    Anti-Aging Share Forecast, By Region (USD Million)
        5.2.2    Comparative Revenue Analysis, By Country, 2022 & 2028
        5.2.3    Key Market Trends, Growth Factors, & Opportunities
    5.3    Female
        5.3.1    Anti-Aging Share Forecast, By Region (USD Million)
        5.3.2    Comparative Revenue Analysis, By Country, 2022 & 2028
        5.3.3    Key Market Trends, Growth Factors, & Opportunities
            
Chapter 6    Global Anti-Aging Market, By Ingredient Segment Analysis

    6.1    Anti-Aging Market Overview, By Ingredient Segment
        6.1.1    Global Anti-Aging Market Value Share, By Ingredient, 2021 & 2028 (Value, %)
    6.2    Retinoid
        6.2.1    Anti-Aging Share Forecast, By Region (USD Million)
        6.2.2    Comparative Revenue Analysis, By Country, 2022 & 2028
        6.2.3    Key Market Trends, Growth Factors, & Opportunities
    6.3    Hyaluronic Acid
        6.3.1    Anti-Aging Share Forecast, By Region (USD Million)
        6.3.2    Comparative Revenue Analysis, By Country, 2022 & 2028
        6.3.3    Key Market Trends, Growth Factors, & Opportunities
    6.4    Alpha Hydroxy Acid
        6.4.1    Anti-Aging Share Forecast, By Region (USD Million)
        6.4.2    Comparative Revenue Analysis, By Country, 2022 & 2028
        6.4.3    Key Market Trends, Growth Factors, & Opportunities
    6.5    Others
        6.5.1    Anti-Aging Share Forecast, By Region (USD Million)
        6.5.2    Comparative Revenue Analysis, By Country, 2022 & 2028
        6.5.3    Key Market Trends, Growth Factors, & Opportunities
        
Chapter 7    Global Anti-Aging Market, By Distribution Channel Segment Analysis

    7.1    Anti-Aging Market Overview, By Distribution Channel Segment
        7.1.1    Global Anti-Aging Market Revenue Share, By Distribution Channel, 2022 & 2028 (Value, %)
    7.2    Pharmacies
        7.2.1    Anti-Aging Share Forecast, By Region (USD Million)
        7.2.2    Comparative Revenue Analysis, By Country, 2021 & 2028
        7.2.3    Key Market Trends, Growth Factors, & Opportunities
    7.3    Stores
        7.3.1    Anti-Aging Share Forecast, By Region (USD Million)
        7.3.2    Comparative Revenue Analysis, By Country, 2021 & 2028
        7.3.3    Key Market Trends, Growth Factors, & Opportunities
    7.4    Online Stores
        7.4.1    Anti-Aging Share Forecast, By Region (USD Million)
        7.4.2    Comparative Revenue Analysis, By Country, 2021 & 2028
        7.4.3    Key Market Trends, Growth Factors, & Opportunities
        
Chapter 8    Global Anti-Aging Market, By Treatment Segment Analysis

    8.1    Anti-Aging Market Overview, By Treatment Segment
        8.1.1    Global Anti-Aging Market Revenue Share, By Treatment, 2022 & 2028 (Value, %)
    8.2    Body Care Treatment
        8.2.1    Anti-Aging Share Forecast, By Region (USD Million)
        8.2.2    Comparative Revenue Analysis, By Country, 2021 & 2028
        8.2.3    Key Market Trends, Growth Factors, & Opportunities
    8.3    Facial Care Treatment
        8.3.1    Anti-Aging Share Forecast, By Region (USD Million)
        8.3.2    Comparative Revenue Analysis, By Country, 2021 & 2028
        8.3.3    Key Market Trends, Growth Factors, & Opportunities
            
Chapter 9    Anti-Aging Market – Regional Analysis, 2022 – 2028

    9.1    Anti-Aging market Overview, by Region Segment
        9.1.1    Global Anti-Aging market Revenue Share, By Region, 2022 & 2028
        9.1.2    Global Anti-Aging Market Revenue, By Region, 2017 – 2028 (US$ Mn)
        9.1.3    Global Anti-Aging market Revenue, By Product, 2017 – 2028 (US$ Mn)
        9.1.4    Global Anti-Aging market Revenue, By Target Group, 2017 – 2028 (US$ Mn)
        9.1.5    Global Anti-Aging Market Revenue, By Ingredient, 2017 – 2028 (US$ Mn)
        9.1.6    Global Anti-Aging Market Revenue, By Distribution Channel, 2017 – 2028 (US$ Mn)
        9.1.7    Global Anti-Aging Market Revenue, By Treatment, 2017 – 2028 (US$ Mn)
    9.2    North America
        9.2.1    North America Anti-Aging Market Revenue, By Country, 2018 – 2028 (US$ Mn)
        9.2.2    North America Anti-Aging Market Revenue, By Product, 2018 – 2028 (US$ Mn)/(Kilo Tons)
        9.2.3    North America Anti-Aging Market Revenue, By Target Group, 2018 – 2028 (US$ Mn)/(Kilo Tons)
        9.2.4    North America Anti-Aging Market Revenue, By Ingredient, 2018 – 2028 (US$ Mn)/(Kilo Tons)
        9.2.5    North America Anti-Aging Market Revenue, By Distribution Channel, 2018 – 2028 (US$ Mn)/(Kilo Tons)
        9.2.6    North America Anti-Aging Market Revenue, By Treatment, 2018 – 2028 (US$ Mn)/(Kilo Tons)
        9.2.7    U.S. Anti-Aging Market Revenue, 2018 - 2028 (US$ Mn)/ (Kilo Tons)
        9.2.8    Canada Anti-Aging Market Revenue, 2018 - 2028 (US$ Mn)/ (Kilo Tons)
        9.2.9    Mexico Anti-Aging Market Revenue, 2018 - 2028 (US$ Mn)/ (Kilo Tons)
    9.3    Europe
        9.3.1    Europe Anti-Aging Market Revenue, By Country, 2018 – 2028 (US$ Mn)
        9.3.2    Europe Anti-Aging Market Revenue, By Product, 2018 – 2028 (US$ Mn)/(Kilo Tons)
        9.3.3    Europe Anti-Aging Market Revenue, By Target Group, 2018 – 2028 (US$ Mn)/(Kilo Tons)
        9.3.4    Europe Anti-Aging Market Revenue, By Ingredient Type, 2018 – 2028 (US$ Mn)/(Kilo Tons)
        9.3.5    Europe Anti-Aging Market Revenue, By Distribution Channel, 2018 – 2028 (US$ Mn)/(Kilo Tons)
        9.3.6    Europe Anti-Aging Market Revenue, By Treatment, 2018 – 2028 (US$ Mn)/(Kilo Tons)
        9.3.7    Germany Anti-Aging Market Revenue, 2018 - 2028 (US$ Mn)/ (Kilo Tons)
        9.3.8    France Anti-Aging Market Revenue, 2018 - 2028 (US$ Mn)/ (Kilo Tons)
        9.3.9    U.K. Anti-Aging Market Revenue, 2018 - 2028 (US$ Mn)/ (Kilo Tons)
        9.3.10    Italy Anti-Aging Market Revenue, 2018 - 2028 (US$ Mn)/ (Kilo Tons)
        9.3.11    Spain Anti-Aging Market Revenue, 2018 - 2028 (US$ Mn)/ (Kilo Tons)
        9.3.12    Rest of Europe Anti-Aging Market Revenue, 2018 - 2028 (US$ Mn)/ (Kilo Tons)
    9.4    Asia Pacific
        9.4.1    Asia Pacific Anti-Aging Market Revenue, By Country, 2018 – 2028 (US$ Mn)
        9.4.2    Asia Pacific Anti-Aging Market Revenue, By Product, 2018 – 2028 (US$ Mn)/(Kilo Tons)
        9.4.3    Asia Pacific Anti-Aging Market Revenue, By Target Group, 2018 – 2028 (US$ Mn)/(Kilo Tons)
        9.4.4    Asia Pacific Anti-Aging Market Revenue, By Ingredient Type, 2018 – 2028 (US$ Mn)/(Kilo Tons)
        9.4.5    Asia Pacific Anti-Aging Market Revenue, By Distribution Channel, 2018 – 2028 (US$ Mn)/(Kilo Tons)
        9.4.6    Asia Pacific Anti-Aging Market Revenue, By Treatment, 2018 – 2028 (US$ Mn)/(Kilo Tons)
        9.4.7    China Anti-Aging Market Revenue, 2018 - 2028 (US$ Mn)/ (Kilo Tons)
        9.4.8    Japan Anti-Aging Market Revenue, 2018 - 2028 (US$ Mn)/ (Kilo Tons)
        9.4.9    India Anti-Aging Market Revenue, 2018 - 2028 (US$ Mn)/ (Kilo Tons)
        9.4.10    South Korea Anti-Aging Market Revenue, 2018 - 2028 (US$ Mn)/ (Kilo Tons)
        9.4.11    South-East Asia Anti-Aging Market Revenue, 2018 - 2028 (US$ Mn)/ (Kilo Tons)
        9.4.12    Rest of Asia Pacific Anti-Aging Market Revenue, 2018 - 2028 (US$ Mn)/ (Kilo Tons)
    9.5    Latin America
        9.5.1    Latin America Anti-Aging Market Revenue, By Country, 2018 – 2028 (US$ Mn)
        9.5.2    Latin America Anti-Aging Market Revenue, By Product, 2018 – 2028 (US$ Mn)/(Kilo Tons)
        9.5.3    Latin America Anti-Aging Market Revenue, By Target Group, 2018 – 2028 (US$ Mn)/(Kilo Tons)
        9.5.4    Latin America Anti-Aging Market Revenue, By Ingredient Type, 2018 – 2028 (US$ Mn)/(Kilo Tons)
        9.5.5    Latin America Anti-Aging Market Revenue, By Distribution Channel, 2018 – 2028 (US$ Mn)/(Kilo Tons)
        9.5.6    Latin America Anti-Aging Market Revenue, By Treatment, 2018 – 2028 (US$ Mn)/(Kilo Tons)
        9.5.7    Brazil Anti-Aging Market Revenue, 2018 - 2028 (US$ Mn)/ (Kilo Tons)
        9.5.8    Argentina Anti-Aging Market Revenue, 2018 - 2028 (US$ Mn)/ (Kilo Tons)
        9.5.9    Rest of Latin America Anti-Aging Market Revenue, 2018 - 2028 (US$ Mn)/ (Kilo Tons)
    9.6    The Middle-East and Africa
        9.6.1    The Middle-East and Africa Anti-Aging Market Revenue, By Country, 2018 – 2028 (US$ Mn)
        9.6.2    The Middle-East and Africa Anti-Aging Market Revenue, By Product, 2018 – 2028 (US$ Mn)/(Kilo Tons)
        9.6.3    The Middle-East and Africa Anti-Aging Market Revenue, By Target Group, 2018 – 2028 (US$ Mn)/(Kilo Tons)
        9.6.4    The Middle-East and Africa Anti-Aging Market Revenue, By Ingredient Type, 2018 – 2028 (US$ Mn)/(Kilo Tons)
        9.6.5    The Middle-East and Africa Anti-Aging Market Revenue, By Distribution Channel, 2018 – 2028 (US$ Mn)/(Kilo Tons)
        9.6.6    The Middle-East and Africa Anti-Aging Market Revenue, By Treatment, 2018 – 2028 (US$ Mn)/(Kilo Tons)
        9.6.7    GCC Countries Anti-Aging Market Revenue, 2018 - 2028 (US$ Mn)/ (Kilo Tons)
        9.6.8    South Africa Anti-Aging Market Revenue, 2018 - 2028 (US$ Mn)/ (Kilo Tons)
        9.6.9    Rest of Middle-East Africa Anti-Aging Market Revenue, 2018 - 2028 (US$ Mn)/ (Kilo Tons)

Chapter 10    Anti-Aging Market – Industry Analysis

    10.1    Introduction
    10.2    Market Drivers
        10.2.1    Driving Factor 1 Analysis
        10.2.2    Driving Factor 2 Analysis
    10.3    Market Restraints
        10.3.1    Restraining Factor Analysis
    10.4    Market Opportunities
        10.4.1    Market Opportunity Analysis
    10.5    Porter’s Five Forces Analysis
    10.6    PEST Analysis
    10.7    Regulatory Landscape
    10.8    Technology Landscape
    10.9      Value Chain Analysis

Chapter 11    Competitive Landscape

    11.1    Company Market Share Analysis – 2022
        11.1.1    Global Anti-Aging market: Company Market Share, 2022
        11.1.2    Global Anti-Aging Market: Company Market Share, 2022
    11.2    Strategic Developments
        11.2.1    Acquisitions & Mergers
        11.2.2    New Product Launch
        11.2.3    Regional Expansion
    11.3    Company Strategic Developments – Heat Map Analysis

Chapter 12    Company Profiles

    12.1    Allergan
        12.1.1    Company Overview
        12.1.2    Key Executives
        12.1.3    Product Portfolio
        12.1.4    Financial Overview
        12.1.5    Operating Business Segments
        12.1.6    Business Segment Performance
        12.1.7    Recent Developments
    12.2    L’Oréal
    12.3    Beiersdorf
    12.4    Estee Lauder
    12.5    Procter & Gamble
    12.6    Shiseido
    12.7    Unilever

Chapter 13    Research Methodology

    13.1    Research Methodology
    13.2    Phase I – Secondary Research
    13.3    Phase II - Data Modeling
        13.3.1    Company Share Analysis Model
        13.3.2    Revenue Based Modelling
    13.4    Phase III – Primary Research
    13.5    Research Limitations
        13.5.1    Assumptions
No Methodology
No Available