Report

src

Global Hydrogen Buses Market Size, Share & COVID-19 Impact Analysis, By Technology (Proton Exchange Membrane Fuel Cells, Direct Methanol Fuel Cells, Phosphoric Acid Fuel Cells, Zinc-Air Fuel Cells and Solid Oxide Fuel Cells), By Power Output (<150 KW, 150–250 KW and >250 KW), By Transit Bus Models (30-Foot Transit Buses, 40-Foot Transit Buses and 60-Foot Transit Buses) and Regional Forecasts, 2023-2030

Customization
  • We provide customized solutions to cater to your specific requirement services any region, product, or any specific market segment.
The global hydrogen buses market size was valued at USD 5.5 billion in 2021. The market is projected to grow from USD 5.5 billion in 2021 to USD 117.2 billion by 2028, exhibiting a CAGR of 66.50% during the forecast period.
 
Concerns over the environment's degradation and the depletion of natural resources are the main factors driving the market for hydrogen buses. This has sped up the development of technology that supports the idea of eco-friendly modes of transportation for maintaining the ecosystem. Additionally, the adoption of hydrogen fuel cell buses is accelerating due to the increase in individuals irritated by the negative impacts of air pollution, rising traffic, and GHG emissions. These buses are environmentally friendly and provide a sustainable transportation choice, in contrast to traditional modes of transportation like cars with gas or diesel engines. Furthermore, technological advancements in hydrogen-powered vehicles significantly impact the market, expanding the potential for hydrogen-powered buses over the forecast period. It is estimated that the market for hydrogen-powered buses will have multiple chances to reach its potential over the anticipated time frame. Additionally, it is anticipated that rising expenditures in the infrastructure for hydrogen fuel cell buses and the associated charging stations would stimulate market growth.
 
COVID-19 IMPACT

The COVID 19 pandemic has not been good for the electric fuel sector, particularly the hydrogen bus industry. The market suffered significantly from a scarcity of raw materials supply, a lack of workforce on manufacturing sites, and a lack of good business strategy execution during the health emergency, which resulted in global lockdowns and the closure of most manufacturing facilities. However, as the cost of gasoline and diesel climbs, so does consumer demand for greener automobiles.
 
DRIVING FACTORS

Growing Eco-Friendly Mobility Importance Offers Market Opportunities for Hydrogen Buses

New hydrogen bus models are being introduced by market participants while taking their usefulness and relevance into consideration. Shortly, favorable market conditions for the industry's players are anticipated by proactive steps to construct infrastructure for hydrogen buses. The operation of hydrogen buses is anticipated to increase due to the growing commercialization initiatives, particularly in Europe. As a result, the market for hydrogen buses is expected to develop over the forecast period.
 
RESTRAINING FACTORS

High Hydrogen Bus Costs May Limit Market Growth

Compared to conventional buses, the initial cost of hydrogen buses is higher. This is a major impediment to implementing hydrogen buses in public transportation by several governments and administrations. Furthermore, governments are providing subsidies for the purchase of private electric vehicles, which may positively impact this market for those looking to buy commercial fleets. Furthermore, even standard hydrogen buses cost more than twice as much as their conventional counterparts, which may hinder the market growth.
 
SEGMENTATION

By Technology


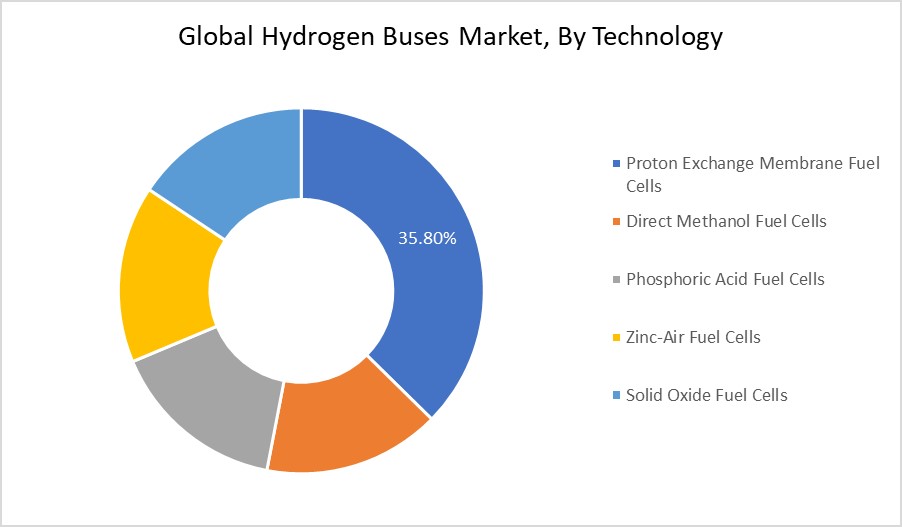
Based on technology, the hydrogen buses market is segmented into Proton Exchange Membrane Fuel Cells, Direct Methanol Fuel Cells, Phosphoric Acid Fuel Cells, Zinc-Air Fuel Cells and Solid Oxide Fuel Cells. The proton exchange membrane fuel cells category dominated the market in 2021. The electrochemical reaction between hydrogen and oxygen releases chemical energy, which is converted into electrical energy using this technology. One of the most popular fuel cell technologies in the EV sector, proton exchange membrane fuel cells are perfect for fuel cell buses.
 
By Power Output

By power output, the market is segmented into <150 KW, 150–250 KW and >250 KW. The <150 KW category dominated the market in 2021. Passenger cars, buses, and commercial vehicles employ fuel cells with power outputs under 150 kW. Less than 150 kW fuel cells have a greater sales rate, so they control the global market.
 
By Transit Bus Models

By transit bus models, the market is segmented into 30-foot transit buses, 40-foot transit buses and 60-foot transit buses. The 30-Foot transit buses category dominated the market in 2021. The hydrogen bus has a power range of 20 kW to 200 kW for transit buses measuring 30 to 40 feet. Due to its effective passenger capacity and competitive pricing, this form of transit model I is widely used in the automotive sector.
 
REGIONAL INSIGHTS

 
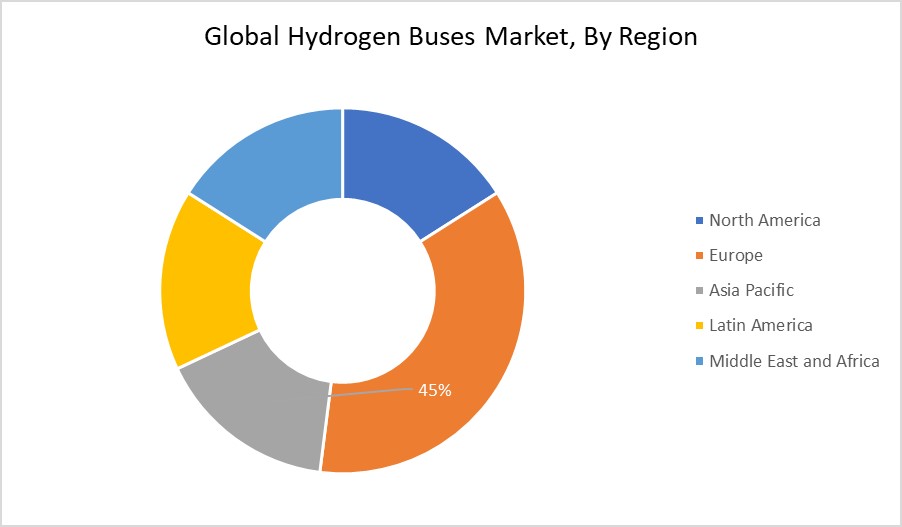
Europe is projected to hold the largest share of the hydrogen buses market over the forecast period. The presence of leading fuel hydrogen bus manufacturers is a key driver boosting the market's growth in Europe. The managing director of Ebusco recently handed the first 90 Ebusco buses to Germany's largest public transportation business in light of the country's growing awareness of EV technology and the high adoption of passenger hydrogen vehicles in the area.
 
On the other hand, the North American hydrogen buses market is anticipated to grow significantly over the forecast period due to the population's rapid growth, the demand for passenger buses increasing demand and the manufacturing scale's quick growth. Eco-friendly hydrogen electric buses are operating for the first time in Korea. In addition, they can reduce fine dust and pollutant emissions while operating as regular public transportation buses.
 
LIST OF KEY COMPANIES PROFILED:
  • Tata Motors Limited
  • Thor Industries
  • Hyundai
  • Ballard Power Systems
  • NovaBus Corporation
  • New Flyer Industries Ltd
  • EvoBus
  • New Flyer
  • Hino Motors Ltd.
  • SunLine Transit Agency
 
KEY INDUSTRY DEVELOPMENTS:
  • July 2022: The Indian Oil Corporation Limited (IOCL) awarded a tender to Tata Motors, the country's largest commercial vehicle maker and top bus builder, for the provision of 15 hydrogen-based proton exchange membrane (PEM) fuel cell buses (IOCL).
  • June 2021: Domenico Nucera, the head of Iveco's bus business unit, stated that the company intended to produce more than 3,000 zero and low-emission buses in the ensuing years, beginning in southern Italy 2023. If the market's response is positive, they intend to proceed with a rate of 1,000 units annually.
REPORT SCOPE AND SEGMENTATION
 
Attributes Details
Study Period 2016-2030
Base Year 2021
Estimated Year 2023
Forecast Period 2023-2030
Historical Period 2016-2020
Unit Revenue (USD Million) and Volume (Kilo Tons)
Segmentation By Technology, By Power Output, By Transit Bus Models and  By Geography
By Technology
  • Proton Exchange Membrane Fuel Cells
  • Direct Methanol Fuel Cells
  • Phosphoric Acid Fuel Cells
  • Zinc-Air Fuel Cells
  • Solid Oxide Fuel Cells
By Power Output
  • <150 KW
  • 150–250 KW
  • >250 KW
By Transit Bus Models
  • 30-Foot Transit Buses
  • 40-Foot Transit Buses
  • 60-Foot Transit Buses
By Region
  • North America
    • U.S.
    • Canada
  • Europe
    • Germany
    • France
    • U.K.
    • Italy
    • Spain
    • Rest of Europe
  • Asia Pacific
    • China
    • Japan
    • India
    • South Korea
    • South-east Asia
    • Rest of Asia Pacific
  • Latin America
    • Brazil
    • Mexico
    • Rest of Latin America
  • Middle East & Africa
    • GCC Countries
    • South Africa
    • Rest of Middle East and Africa
Chapter 1    Preface

    1.1    Report Scope and Description
        1.1.1    Study Purpose
        1.1.2    Target Audience
        1.1.3    USP and Key Offerings
    1.2    Key Benefits for Stakeholders
    1.3    Report Scope

Chapter 2    Report Summary

    2.1    Key Findings
        2.1.1    Top Investment Pockets
    2.2    Market Snapshot: Global Hydrogen Buses Market
    2.3    Global Hydrogen Buses Market, 2019 – 2030 (US$ Mn)

Chapter 3    COVID 19 Impact Analysis

    3.1    Impact Assessment of COVID-19 Pandemic, By Region
        3.1.1    North America: Impact of COVID-19 Pandemic
        3.1.2    Europe: Impact of COVID-19 Pandemic
        3.1.3    Asia pacific: Impact of COVID-19 Pandemic
        3.1.4    Latin America: Impact of COVID-19 Pandemic
        3.1.5    Middle-East and Africa: Impact of COVID-19 Pandemic
    3.2    Key Strategies Undertaken by Companies to Tackle COVID-19
    3.3    Quarterly Market Revenue by Region 2021 & 2023
    3.4    Pre COVID-19 Market Revenue, By Region, 2016-2019        (USD Million)
    3.5    Post COVID-19 Market Revenue, By Region, 2020-2030 (USD Million)
    3.6    Short Term Dynamics
    3.7    Long Term Dynamics

Chapter 4    Global Hydrogen Buses Market, By Technology Segment Analysis

    4.1    Hydrogen Buses Market Overview, By Technology Segment
        4.1.1    Global Hydrogen Buses Market Revenue Share, By Technology, 2023 & 2030 (Value, %)
    4.2    Proton Exchange Membrane Fuel Cells
        4.2.1    Hydrogen Buses Share Forecast, By Region (USD Million)
        4.2.2    Comparative Revenue Analysis, By Country, 2021 & 2030
        4.2.3    Key Market Trends, Growth Factors, & Opportunities
    4.3    Direct Methanol Fuel Cells
        4.3.1    Hydrogen Buses Share Forecast, By Region (USD Million)
        4.3.2    Comparative Revenue Analysis, By Country, 2021 & 2030
        4.3.3    Key Market Trends, Growth Factors, & Opportunities
    4.4    Phosphoric Acid Fuel Cells
        4.4.1    Hydrogen Buses Share Forecast, By Region (USD Million)
        4.4.2    Comparative Revenue Analysis, By Country, 2021 & 2030
        4.4.3    Key Market Trends, Growth Factors, & Opportunities
    4.5    Zinc-Air Fuel Cells
        4.5.1    Hydrogen Buses Share Forecast, By Region (USD Million)
        4.5.2    Comparative Revenue Analysis, By Country, 2021 & 2030
        4.5.3    Key Market Trends, Growth Factors, & Opportunities
    4.6    Solid Oxide Fuel Cells
        4.6.1    Hydrogen Buses Share Forecast, By Region (USD Million)
        4.6.2    Comparative Revenue Analysis, By Country, 2021 & 2030
        4.6.3    Key Market Trends, Growth Factors, & Opportunities
        
Chapter 5    Global Hydrogen Buses Market, By Power Output Segment Analysis

    5.1    Hydrogen Buses Market Overview, By Power Output Segment
        5.1.1    Global Hydrogen Buses Market Revenue Share, By Power Output, 2023 & 2030 (Value, %)
    5.2    <150 KW
        5.2.1    Hydrogen Buses Share Forecast, By Region (USD Million)
        5.2.2    Comparative Revenue Analysis, By Country, 2023 & 2030
        5.2.3    Key Market Trends, Growth Factors, & Opportunities
    5.3    150–250 KW
        5.3.1    Hydrogen Buses Share Forecast, By Region (USD Million)
        5.3.2    Comparative Revenue Analysis, By Country, 2023 & 2030
        5.3.3    Key Market Trends, Growth Factors, & Opportunities
    5.4    >250 KW
        5.4.1    Hydrogen Buses Share Forecast, By Region (USD Million)
        5.4.2    Comparative Revenue Analysis, By Country, 2023 & 2030
        5.4.3    Key Market Trends, Growth Factors, & Opportunities
        
Chapter 6    Global Hydrogen Buses Market, By Transit Bus Models Segment Analysis

    6.1    Hydrogen Buses Market Overview, By Transit Bus Models Segment
        6.1.1    Global Hydrogen Buses Market Value Share, By Transit Bus Models, 2021 & 2030 (Value, %)
    6.2    30-Foot Transit Buses
        6.2.1    Hydrogen Buses Share Forecast, By Region (USD Million)
        6.2.2    Comparative Revenue Analysis, By Country, 2023 & 2030
        6.2.3    Key Market Trends, Growth Factors, & Opportunities
    6.3    40-Foot Transit Buses
        6.3.1    Hydrogen Buses Share Forecast, By Region (USD Million)
        6.3.2    Comparative Revenue Analysis, By Country, 2023 & 2030
        6.3.3    Key Market Trends, Growth Factors, & Opportunities
    6.3    60-Foot Transit Buses
        6.3.1    Hydrogen Buses Share Forecast, By Region (USD Million)
        6.3.2    Comparative Revenue Analysis, By Country, 2023 & 2030
        6.3.3    Key Market Trends, Growth Factors, & Opportunities
        
Chapter 7    Hydrogen Buses Market – Regional Analysis, 2023 – 2030

    7.1    Hydrogen Buses market Overview, by Region Segment
        7.1.1    Global Hydrogen Buses market Revenue Share, By Region, 2023 & 2030
        7.1.2    Global Hydrogen Buses Market Revenue, By Region, 2017 – 2030 (US$ Mn)
        7.1.3    Global Hydrogen Buses market Revenue, By Technology, 2017 – 2030 (US$ Mn)
        7.1.4    Global Hydrogen Buses market Revenue, By Power Output, 2017 – 2030 (US$ Mn)
        7.1.5    Global Hydrogen Buses Market Revenue, By Transit Bus Models, 2017 – 2030 (US$ Mn)
    7.2    North America
        7.2.1    North America Hydrogen Buses Market Revenue, By Country, 2019 – 2030 (US$ Mn)
        7.2.2    North America Hydrogen Buses Market Revenue, By Technology, 2019 – 2030 (US$ Mn)/(Kilo Tons)
        7.2.3    North America Hydrogen Buses Market Revenue, By Power Output, 2019 – 2030 (US$ Mn)/(Kilo Tons)
        7.2.4    North America Hydrogen Buses Market Revenue, By Transit Bus Models, 2019 – 2030 (US$ Mn)/(Kilo Tons)
        7.2.5    U.S. Hydrogen Buses Market Revenue, 2019 - 2030 (US$ Mn)/ (Kilo Tons)
        7.2.6    Canada Hydrogen Buses Market Revenue, 2019 - 2030 (US$ Mn)/ (Kilo Tons)
        7.2.7    Mexico Hydrogen Buses Market Revenue, 2019 - 2030 (US$ Mn)/ (Kilo Tons)
    7.3    Europe
        7.3.1    Europe Hydrogen Buses Market Revenue, By Country, 2019 – 2030 (US$ Mn)
        7.3.2    Europe Hydrogen Buses Market Revenue, By Technology, 2019 – 2030 (US$ Mn)/(Kilo Tons)
        7.3.3    Europe Hydrogen Buses Market Revenue, By Power Output, 2019 – 2030 (US$ Mn)/(Kilo Tons)
        7.3.4    Europe Hydrogen Buses Market Revenue, By Transit Bus Models, 2019 – 2030 (US$ Mn)/(Kilo Tons)
        7.3.5    Germany Hydrogen Buses Market Revenue, 2019 - 2030 (US$ Mn)/ (Kilo Tons)
        7.3.6    France Hydrogen Buses Market Revenue, 2019 - 2030 (US$ Mn)/ (Kilo Tons)
        7.3.7    U.K. Hydrogen Buses Market Revenue, 2019 - 2030 (US$ Mn)/ (Kilo Tons)
        7.3.8    Italy Hydrogen Buses Market Revenue, 2019 - 2030 (US$ Mn)/ (Kilo Tons)
        7.3.9    Spain Hydrogen Buses Market Revenue, 2019 - 2030 (US$ Mn)/ (Kilo Tons)
        7.3.10    Rest of Europe Hydrogen Buses Market Revenue, 2019 - 2030 (US$ Mn)/ (Kilo Tons)
    7.4    Asia Pacific
        7.4.1    Asia Pacific Hydrogen Buses Market Revenue, By Country, 2019 – 2030 (US$ Mn)
        7.4.2    Asia Pacific Hydrogen Buses Market Revenue, By Technology, 2019 – 2030 (US$ Mn)/(Kilo Tons)
        7.4.3    Asia Pacific Hydrogen Buses Market Revenue, By Power Output, 2019 – 2030 (US$ Mn)/(Kilo Tons)
        7.4.4    Asia Pacific Hydrogen Buses Market Revenue, By Transit Bus Models, 2019 – 2030 (US$ Mn)/(Kilo Tons)
        7.4.5    China Hydrogen Buses Market Revenue, 2019 - 2030 (US$ Mn)/ (Kilo Tons)
        7.4.6    Japan Hydrogen Buses Market Revenue, 2019 - 2030 (US$ Mn)/ (Kilo Tons)
        7.4.7    India Hydrogen Buses Market Revenue, 2019 - 2030 (US$ Mn)/ (Kilo Tons)
        7.4.8    South Korea Hydrogen Buses Market Revenue, 2019 - 2030 (US$ Mn)/ (Kilo Tons)
        7.4.9    South-East Asia Hydrogen Buses Market Revenue, 2019 - 2030 (US$ Mn)/ (Kilo Tons)
        7.4.10    Rest of Asia Pacific Hydrogen Buses Market Revenue, 2019 - 2030 (US$ Mn)/ (Kilo Tons)
    7.5    Latin America
        7.5.1    Latin America Hydrogen Buses Market Revenue, By Country, 2019 – 2030 (US$ Mn)
        7.5.2    Latin America Hydrogen Buses Market Revenue, By Technology, 2019 – 2030 (US$ Mn)/(Kilo Tons)
        7.5.3    Latin America Hydrogen Buses Market Revenue, By Power Output, 2019 – 2030 (US$ Mn)/(Kilo Tons)
        7.5.4    Latin America Hydrogen Buses Market Revenue, By Transit Bus Models, 2019 – 2030 (US$ Mn)/(Kilo Tons)
        7.5.5    Brazil Hydrogen Buses Market Revenue, 2019 - 2030 (US$ Mn)/ (Kilo Tons)
        7.5.6    Argentina Hydrogen Buses Market Revenue, 2019 - 2030 (US$ Mn)/ (Kilo Tons)
        7.5.7    Rest of Latin America Hydrogen Buses Market Revenue, 2019 - 2030 (US$ Mn)/ (Kilo Tons)
    7.6    The Middle-East and Africa
        7.6.1    The Middle-East and Africa Hydrogen Buses Market Revenue, By Country, 2019 – 2030 (US$ Mn)
        7.6.2    The Middle-East and Africa Hydrogen Buses Market Revenue, By Technology, 2019 – 2030 (US$ Mn)/(Kilo Tons)
        7.6.3    The Middle-East and Africa Hydrogen Buses Market Revenue, By Power Output, 2019 – 2030 (US$ Mn)/(Kilo Tons)
        7.6.4    The Middle-East and Africa Hydrogen Buses Market Revenue, By Transit Bus Models, 2019 – 2030 (US$ Mn)/(Kilo Tons)
        7.6.5    GCC Countries Hydrogen Buses Market Revenue, 2019 - 2030 (US$ Mn)/ (Kilo Tons)
        7.6.6    South Africa Hydrogen Buses Market Revenue, 2019 - 2030 (US$ Mn)/ (Kilo Tons)
        7.6.7    Rest of Middle-East Africa Hydrogen Buses Market Revenue, 2019 - 2030 (US$ Mn)/ (Kilo Tons)

Chapter 8    Hydrogen Buses Market – Industry Analysis

    8.1    Introduction
    8.2    Market Drivers
        8.2.1    Driving Factor 1 Analysis
        8.2.2    Driving Factor 2 Analysis
    8.3    Market Restraints
        8.3.1    Restraining Factor Analysis
    8.4    Market Opportunities
        8.4.1    Market Opportunity Analysis
    8.5    Porter’s Five Forces Analysis
    8.6    PEST Analysis
    8.7    Regulatory Landscape
    8.8    Technology Landscape
    8.9    Value Chain Analysis

Chapter 9    Competitive Landscape

    9.1    Company Market Share Analysis – 2023
        9.1.1    Global Hydrogen Buses market: Company Market Share, 2023
        9.1.2    Global Hydrogen Buses Market: Company Market Share, 2023
    9.2    Strategic Developments
        9.2.1    Acquisitions & Mergers
        9.2.2    New Product Launch
        9.2.3    Regional Expansion
    9.3    Company Strategic Developments – Heat Map Analysis

Chapter 10    Company Profiles

    10.1    Tata Motors Limited
        10.1.1    Company Overview
        10.1.2    Key Executives
        10.1.3    Product Portfolio
        10.1.4    Financial Overview
        10.1.5    Operating Business Segments
        10.1.6    Business Segment Performance
        10.1.7    Recent Developments
    10.2    Thor Industries
    10.3    Hyundai
    10.4    Ballard Power Systems
    10.5    NovaBus Corporation
    10.6    New Flyer Industries Ltd
    10.7    EvoBus
    10.8    New Flyer
    10.9    Hino Motors Ltd.
    10.10    SunLine Transit Agency

Chapter 11    Research Methodology

    11.1    Research Methodology
    11.2    Phase I – Secondary Research
    11.3    Phase II - Data Modeling
        11.3.1    Company Share Analysis Model
        11.3.2    Revenue Based Modeling
    11.4    Phase III – Primary Research
    11.5    Research Limitations
        11.5.1    Assumptions
No Methodology
No Available